
healthcare sustainability
The U.S.’s Lackluster COVID-19 Performance, in Two Graphs, By Randall Bolten


The nations of the wealthy west are coming out of their pandemic foxholes and reopening their economies, even as some developing nations are seeing explosive growth in new cases. This is a good moment to take stock and evaluate the U.S.’s response to-date to the pandemic. Only a comparison of the U.S. to other nations – particularly those with comparable healthcare infrastructures and wealth – can be meaningful. We’ll do that here in two graphs, showing trends in new cases and in testing. The results are not flattering to the U.S.
New Cases
We’ve all seen those lovely, symmetrical “flattening the curve” graphs, but is that what a country’s graph of new COVID-19 cases really looks like? The following graph compares new cases trends for the U.S., Canada, and the dozen nations that have seen the most cases in western Europe. Graphing rates per 1MM population enables country-to-country comparisons. Each country’s graph starts on the day it reached a threshold amount of 10 total cases per 1MM population (about 3,300 cases in the U.S):
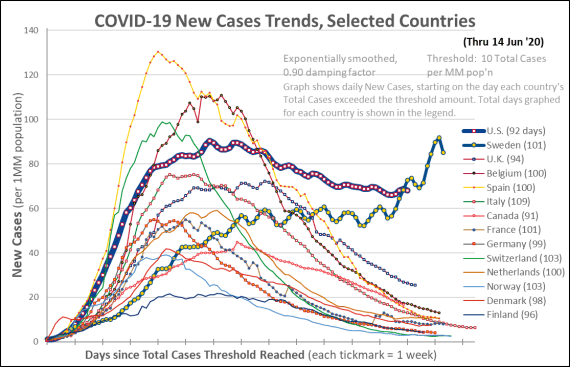
Look closely, following any single country’s curve, and you’ll see that almost all of the countries have bell-shaped curves that rise rapidly, reach a peak at four to seven weeks, and then start to decline – much like those stylized “flattening the curve” graphs. The principle differences lie in the level of peak rates and the speed of the decline from that peak – some countries have “flattened the curve” better than others. Now, 13 to 15 weeks along in each country’s pandemic, 12 of the 14 countries have dramatically reduced their rate of new cases – all of these but the U.K. now have new cases rates of 10/MM/day or less.
Two countries stand out as exceptions: the U.S. and Sweden. Sweden is an outlier, because it’s the only country in the wealthy west that chose a more laissez-fair approach, keeping schools and most businesses open. Perhaps as a result, even now, 14 weeks into Sweden’s pandemic, new cases are continuing to rise, to rates exceeded only by a handful of countries at their peaks.
The U.S. doesn’t have the same excuse. Like all the countries shown other than Sweden, we shut down our economy in order to slow the progression of the pandemic. However, it’s clear from the shape of the U.S. curve that not only was our peak higher than all but three of the other countries, the rate of new cases has dropped only slightly in the eight weeks since then. In other words, we haven’t gotten nearly the same bang per buck as the other 12 countries.
Some federal and state government officials have asserted that the number of new cases isn’t dropping because the U.S. is doing more testing. While it is true that more testing will uncover more cases, that assertion doesn’t hold water. As we’ll see below, the amount of testing being performed is increasing all over the world, and the U.S.’s rate of testing is not exceptional. So why is the rate of new cases throughout the rest of the wealthy world continuing to decline, but not in the U.S.?
Testing
Testing is essential for controlling the spread of the pandemic, not only to diagnose the sick, but also to identify hot spots and enable contact tracing, and to monitor employee health in strategic or high-risk industries like health care and food service. There are two reasons for testing: “Necessary Tests” are driven simply by caseload – a person who complains of symptoms must be tested at least once to confirm the disease and at least two more times to confirm they have recovered, and people especially close to the patient must of course be tested as well – we’ll assume that on average, each diagnosed case ultimately generates six such “Necessary Tests”. “Strategic Tests” are tests resulting from contact tracing and ongoing testing in key industries. Strategic Tests is the difference between Total Tests and Necessary Tests.
The graph below shows Total Strategic Tests per MM performed in 41 countries since late April. The countries include all of western Europe, most of the rest of Europe, and a few other affluent countries around the world. The 41 countries shown, most of which are named on the graph, have seen nearly two-thirds of the world’s COVID-19 cases. You’ll note that a few have testing level that are literally “off the chart”, with Iceland “off the chart” right from the beginning.
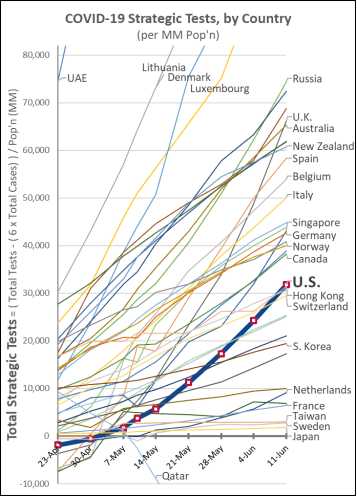
Even without seeing the raw numbers, it’s clear from this graph that when it comes to testing compared to the rest of the wealthy world, the U.S. is at best in the middle of the pack. While the U.S. has “upped its game” in the last few weeks when it comes to strategic testing – from an embarrassing beginning – so have most of the other affluent nations in the world. The assertion that the U.S. leads the world in testing is flatly untrue.
A recent news item offers a stark comparison: out of concern for a second wave of the pandemic, over two weeks Chinese authorities oversaw COVID-19 testing of 9.9 million people just in Wuhan, China, a city with a population of about 11 million. By comparison, in the U.S., the entire nation had performed a total of about 24 million tests, about 4 million of which were performed in the week ending June 11.
The numbers tell a powerful story, about which countries are doing an effective job combating the COVID-19 pandemic. Many countries in the wealthy west are doing a remarkably effective job under novel and challenging circumstances. That is less true for the U.S., a nation that prides itself on being a world leader in pretty much everything.


